
from
Matthieu Lienart
Cloud Engineer, from Ostermundigen
Cloud Engineer, from Ostermundigen
Logging LangChain to AWS CloudWatch
LangChain is a popular framework for developing applications powered by large language models, providing components for working with LLMs through composable chains and agents. When building production applications with LangChain, proper logging becomes essential for monitoring, debugging, and auditing your AI systems. AWS CloudWatch is the natural choice for logging in my serverless context, offering centralized log storage, metrics, and powerful analysis capabilities.
What is the problem?
In my previous article «A Serverless Chatbot with LangChain & AWS Bedrock», I presented a solution for a serverless Chatbot with LangChain and AWS Bedrock, having all the features of:
- Conversation history
- Answering in the user language
- Custom context using RAG
- Model guardrails
- Structured output
As the described solution aims to be running on AWS Lambda, I naturally want to export all those logs to AWS CloudWatch.
The problem is that just using langchain.globals.set_debug function produces verbose, unstructured logs that become virtually unusable in CloudWatch. These logs are difficult to read, impossible to query effectively with CloudWatch Insights, and lack the context needed for proper debugging. For CloudWatch to deliver its full value, logs must be stored in a structured JSON format with consistent fields and meaningful metadata that can be filtered and analyzed programmatically.
The problem is that just using langchain.globals.set_debug function produces verbose, unstructured logs that become virtually unusable in CloudWatch. These logs are difficult to read, impossible to query effectively with CloudWatch Insights, and lack the context needed for proper debugging. For CloudWatch to deliver its full value, logs must be stored in a structured JSON format with consistent fields and meaningful metadata that can be filtered and analyzed programmatically.
The Solution
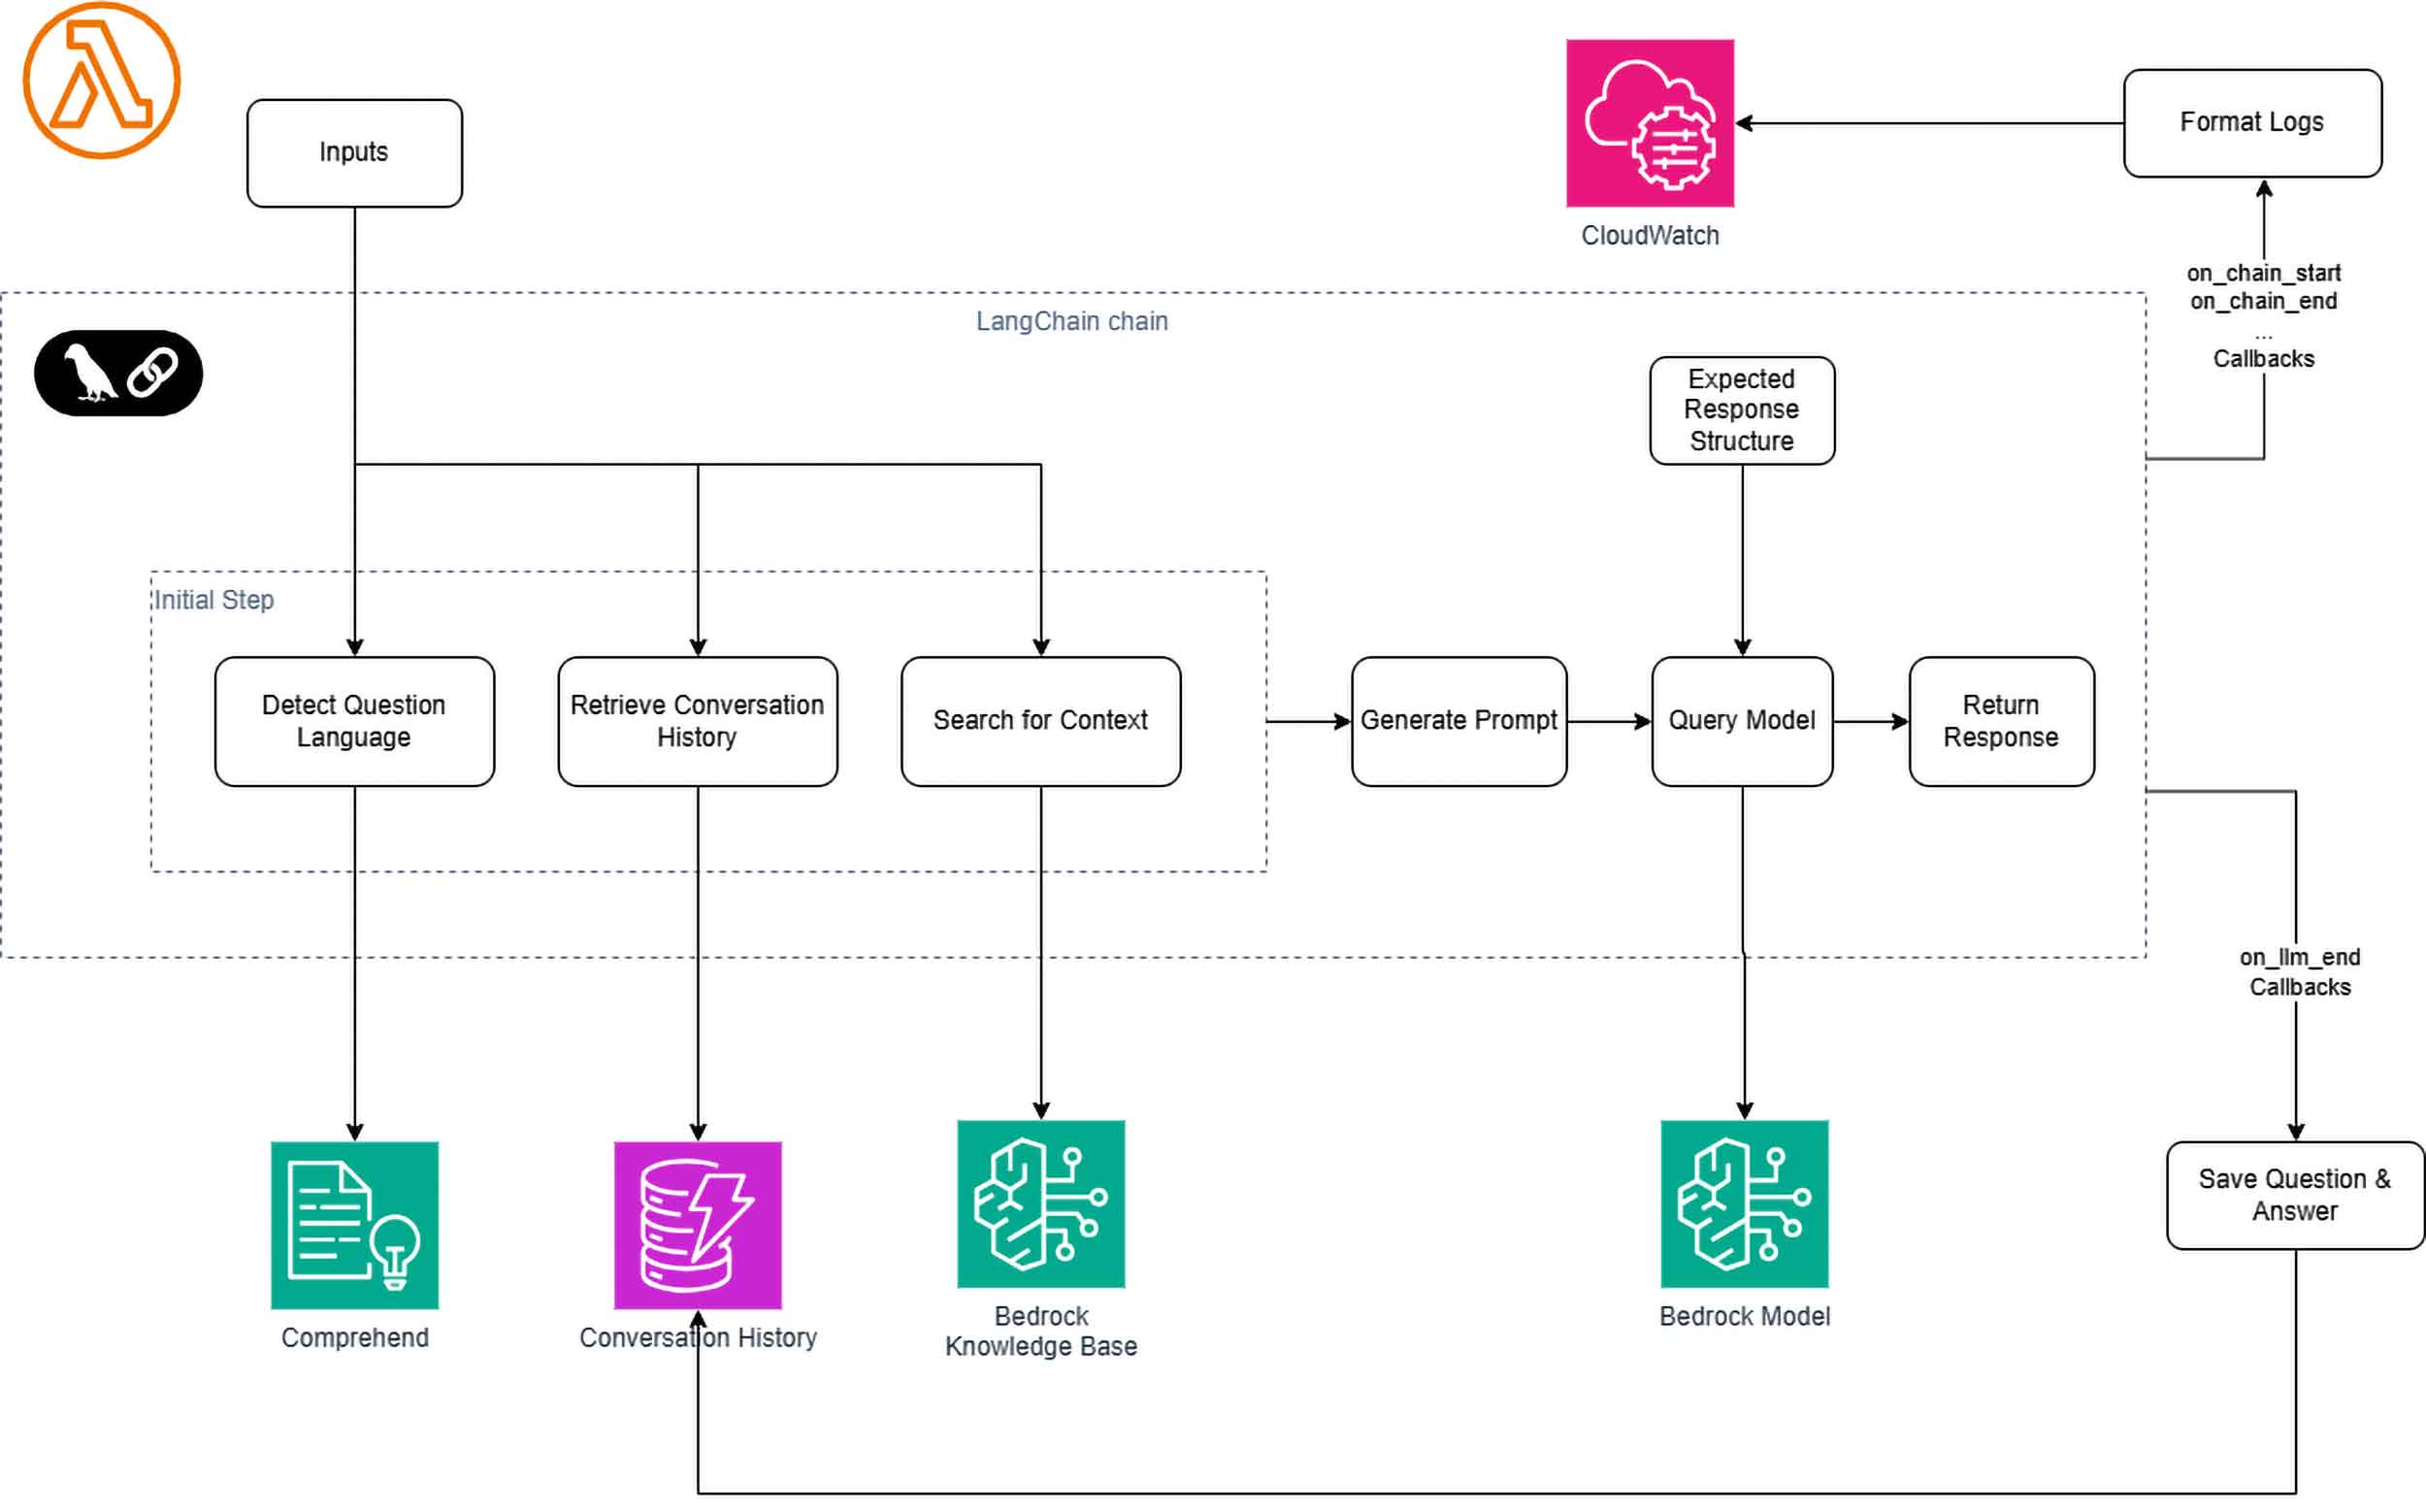
In essence, I created a structured logging system that transforms LangChain's verbose text output into CloudWatch-friendly structured JSON format. This solution enables effective monitoring, troubleshooting, and analysis of the LangChain applications in an AWS environment.
I use a LangChain Callback to capture LangChain actions, format the logs and send them to CloudWatch using the AWS Lambda PowerTools Logger. An advantage of this custom approach is that logs can be enriched with custom metadata, like a session or user ID.
I use a LangChain Callback to capture LangChain actions, format the logs and send them to CloudWatch using the AWS Lambda PowerTools Logger. An advantage of this custom approach is that logs can be enriched with custom metadata, like a session or user ID.

Figure 1: High-level architecture of the serverless chatbot
For the full code, you can refer to the Jupyter notebook in this GitHub repository. While the notebook demonstrates the components locally, and the logs are just printed after being formatted, instead of being sent to CloudWatch, the principles apply directly to a Lambda Function deployment.
Using a Callback for Logging
The approach I use here is to use LangChain callbacks on actions like on_chain_start, on_chain_end, on_chain_error, etc. to capture and log the actions in the Chain.
Since the messages of chain actions or LLM prompts and answers can be long and contain sensitive information, I provide parameters like exclude_inputs, exclude_outputs, to the Callback to have the ability to redact such content.
The full list of LangChain callbacks is available here.
The Logging callback is structured as follow:
The full list of LangChain callbacks is available here.
The Logging callback is structured as follow:
class LoggingHandler(BaseCallbackHandler):
    def __init__(
        self,
        session_id: str,
        exclude_inputs: bool = False,
        exclude_outputs: bool = False,
    ):
        self.session_id = session_id
        self.exclude_inputs = exclude_inputs
        self.exclude_outputs = exclude_outputs

    def _parse_dict_values(…):
        …

    def on_chain_start(…):
        …

    def on_chain_end(…):
       …

    def on_llm_start(…):
       …

    def on_llm_end(…):
       …

    def on_chain_error(…):
       …

    def on_llm_error(…):
       …
Parsing the Logs
Inputs, outputs, prompts, model answers, etc. making the content of the callbacks, are dictionaries including LangChain serializable objects. In order to prepare those data and ensure that all nested objects are converted into standard Python types that can be easily handled by CloudWatch Logs, it needs to go through the dictionary recursively and serialize the LangChain objects. This is done by the utility function _parse_dict_values().
def _parse_dict_values(self, obj: Any) -> Any:
    if isinstance(obj, Serializable):
        return obj.model_dump()
    if isinstance(obj, dict):
        return {k: self._parse_dict_values(v) for k, v in obj.items()}
    if isinstance(obj, list):
        return [self._parse_dict_values(item) for item in obj]
    return obj
Logging LangChain Steps
Logging LangChain steps like on_chain_start, on_chain_end, then involves
- Redacting the content if instructed so
- Else serialize the content
- Then log to CloudWatch
def on_chain_start(
    self,
    serialized: dict,
    inputs: dict,
    run_id: UUID,
    parent_run_id: UUID | None = None,
    tags: list[str] | None = None,
    metadata: dict | None = None,
    **kwargs,
) -> Any:
    if self.exclude_inputs:
        sanitized_inputs = ""
    else:
        sanitized_inputs = self._parse_dict_values(inputs)
    logger.info(
        {
            "callback": "chain/start",
            "action_name": self._get_name_from_callback(serialized, **kwargs),
            "session_id": self.session_id,
            "run_id": str(run_id),
            "parent_run_id": str(parent_run_id),
            "inputs": sanitized_inputs,
            "tags": tags,
            "metadata": metadata,
        }
    )

def on_chain_end(
    self, outputs: dict, run_id: UUID, parent_run_id: UUID | None = None, **kwargs
) -> Any:
    if self.exclude_outputs:
        sanitized_outputs = ""
    else:
        sanitized_outputs = self._parse_dict_values(outputs)
    logger.info(
        {
            "callback": "chain/end",
            "action_name": self._get_name_from_callback(serialized, **kwargs),
            "session_id": self.session_id,
            "run_id": str(run_id),
            "parent_run_id": str(parent_run_id),
            "outputs": sanitized_outputs,
            "tags": kwargs.get("tags", []),
        }
    )
The _get_name_from_callback() is another utility function which tries to extract the action name in different ways depending on the content of the data. Refer to the a href="https://github.com/amanoxsolutions/langchain-awsbedrock-demo/blob/main/langchain-awsbedrock-demo.ipynb" target="_new">Jupyter notebook for the full LoggingHandler code with all the callbacks and utility functions.
The Results
The logs are formatted as desired ready for the AWS Lambda Power Tools logger and AWS CloudWatch as shown in one example below.
{
    "level": "INFO",
    "location": "on_chain_start:122",
    "message": {
        "callback": "chain/start",
        "action_name": "RunnableSequence",
        "session_id": "cda54b41-8c10-47f9-87f8-f0c04a96731a",
        "run_id": "0174cf48-b8f3-4418-8d7c-13b9b0881938",
        "parent_run_id": "None",
        "inputs": {
            "question": "Wie stimmen Sie die Entwicklung eng mit den Unternehmenszielen ab?"
        },
        "tags": [],
        "metadata": {}
    },
    "timestamp": "2025-06-05 13:26:14,029+0000",
    "service": "service_undefined",
    "cold_start": false,
    "function_name": "my-function",
    "function_memory_size": "128",
    "function_arn": "arn:aws:lambda:us-east-1:************:function: my-function ",
    "function_request_id": "1ef2901b-a061-40a5-9a4e-eb20ea80fc1b",
    "xray_trace_id": "1-68419af5-730d439a2c0074857ace2227"
}
Notice how the log entry contains:
- Standard CloudWatch fields like level, timestamp, and Lambda execution context
- Our custom message object with LangChain-specific information
- Custom metadata like the session_id that allows tracking the logs for a user's entire conversation
- The actual content of inputs (which could be redacted if sensitive)
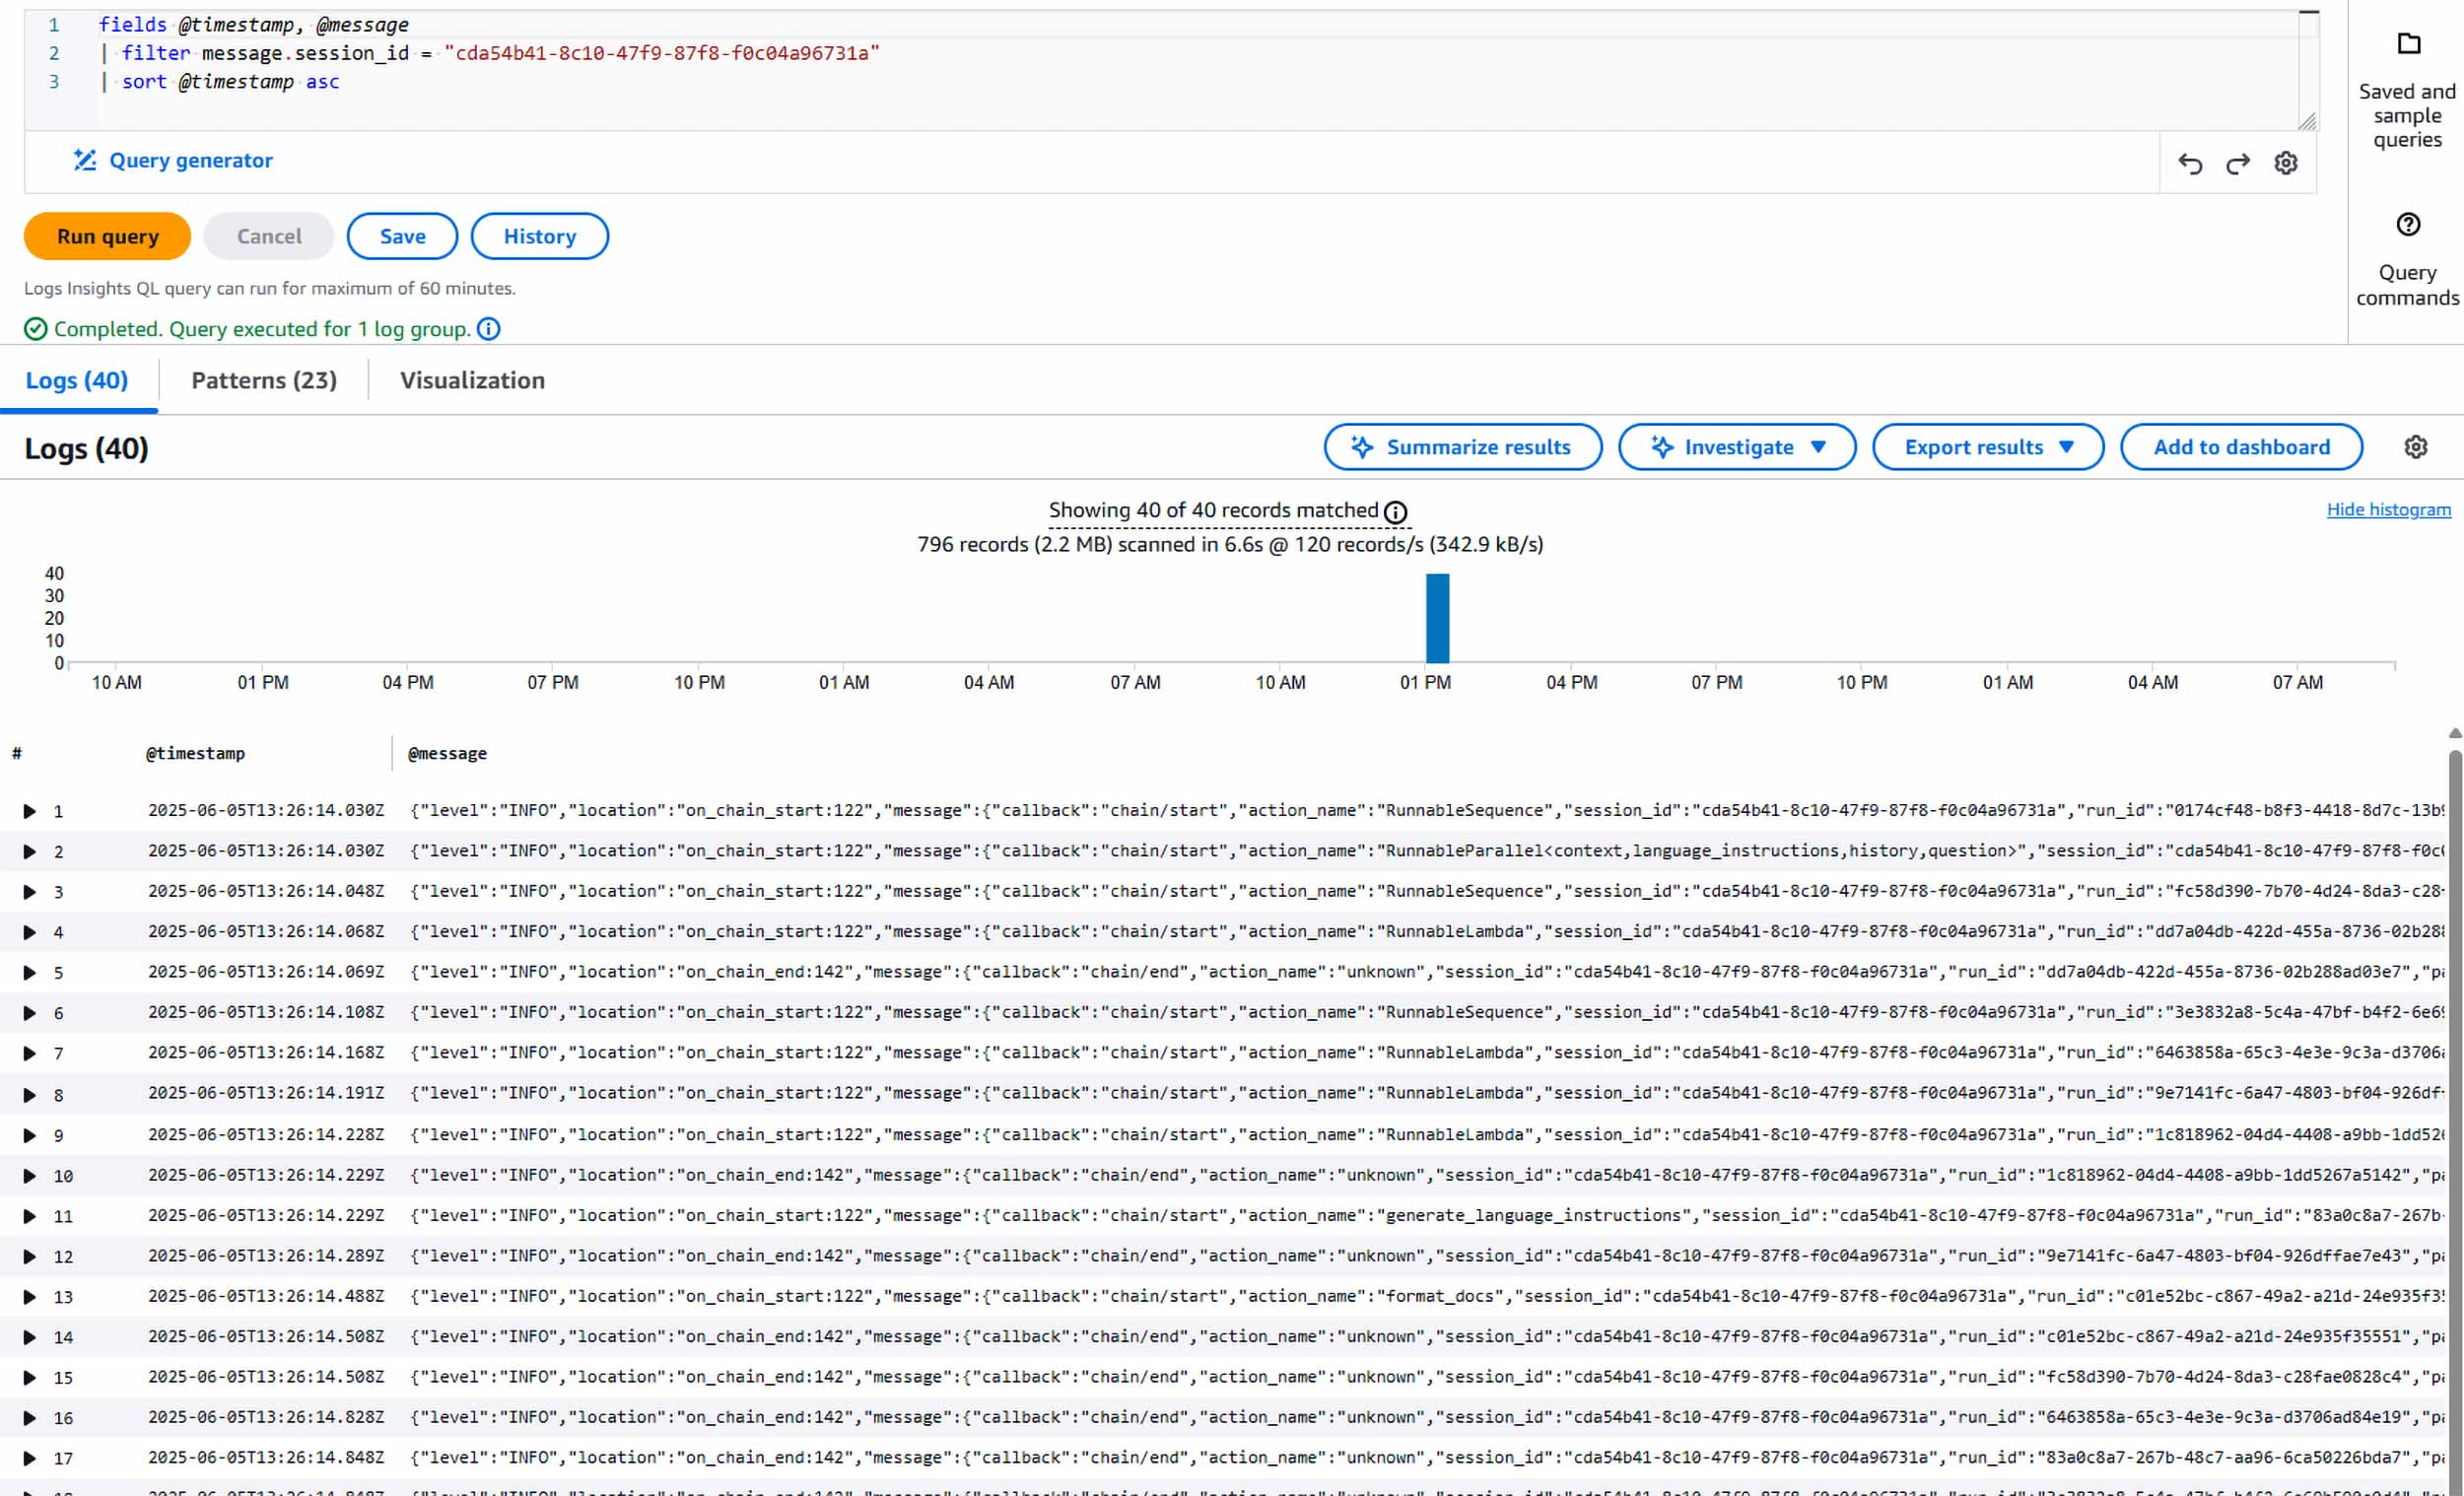
fields @timestamp, @message
| filter message.session_id = "cda54b41-8c10-47f9-87f8-f0c04a96731a"
| sort @timestamp asc

Image 1: Retrieving all LangChain logs for a specific user sessionn
Lessons Learned
Building upon my previous article on serverless LangChain applications, this logging implementation has revealed additional insights worth sharing:
- CloudWatch-friendly logging matters: Simply dumping LangChain's native logs to CloudWatch creates more problems than it solves. Designing logs specifically for CloudWatch's query capabilities enables effective monitoring and analysis.
- Balance detail with privacy: When logging LLM interactions, you must carefully balance capturing sufficient detail for debugging against protecting sensitive information which might be contained in prompts and answers. The parameterized redaction approach demonstrated here offers a flexible solution.
- Custom callbacks provide control: While LangChain offers built-in logging capabilities, custom callbacks give you precise control over what gets logged and how it's formatted, which is essential for production environments.


